
Castle Biosciences Inc (CSTL)
Castle Biosciences sells molecular diagnostic tests that help clinicians diagnose and treat skin cancers and certain other conditions. It last closed at $34.94 on Nov 2. CSTL reports earnings on Thu, Nov 5, 2026.
Key Stats
Last 12 monthsNot reported for this period.
From CSTL's SEC filings, latest 10-Q for the period ending Jun 30, 2026 (filed Jul 30). Last 12 months adds up the four latest quarters.
Earnings
Earnings calendar →Analyst Ratings & Price Targets
Analyst Ratings →| Date | Firm | Action | Rating | Price target |
|---|---|---|---|---|
| Aug 3 | BTIG | Maintained | Buy | $44 |
| Jun 25 | Roth Capital | Initiated | Buy | $40 |
Technical Analysis
The stock is 3% above its 20 day and 2% above its 50 day average. It is 18% above its 200 day average, so the longer trend is still up. Momentum is improving (RSI 52). The nearest support is the 50 day average at $34.23, and the nearest resistance the swing high (Aug 25) at $35.20.
| RSI (14) | 51.82 | Middle of its range | Neutral |
| MACD | 0.61 | Above its signal line | Bullish |
| Stochastic | 73.7 | Middle of its range | Neutral |
| ADX (14) | 21.5 | Weak trend | |
| Williams %R | -53.7 | Oversold below −80, overbought above −20 | Neutral |
| CCI (20) | 90.3 | Oversold below −100, overbought above 100 | Neutral |
| Rate of change | +8.6% | Change over 10 sessions | Bullish |
| ATR (14) | $1.80 | Typical daily range, 5.2% of price |
| RSI (14) | 58.92 | Middle of its range | Neutral |
| MACD | 2.36 | Above its signal line | Bullish |
| Stochastic | 73.8 | Middle of its range | Neutral |
| ADX (14) | 33.8 | Trending up | |
| Williams %R | -34.8 | Oversold below −80, overbought above −20 | Neutral |
| CCI (20) | 81.0 | Oversold below −100, overbought above 100 | Neutral |
| Rate of change | +4.3% | Change over 10 sessions | Bullish |
| ATR (14) | $3.51 | Typical daily range, 10.1% of price |
What happened before
See how CSTL did after each of today's signals in the past: how often it was higher 10 sessions later, and the typical move, next to its usual record.
Calculated from daily prices after each close. Signals describe the chart, not where the stock will go. Past patterns often fail. Not investment advice.
Seasonality
How CSTL has done in each calendar month: the average and median return, how often each month finished higher, and every year since 2019.
Whale Options Flow
90DNo whale options trades in CSTL in the last 90 days.
CSTL Institutional Ownership
Hedge fund holdings →- Mackenzie Financial Corp+719K sh$17.2M
- Jefferies Financial Group Inc.+647K sh$15.4M
- Point72 Asset Management, L.P.+357K sh$8.5M
- Kennedy Capital Management LLC+348K sh$8.3M
- BlackRock, Inc.+309K sh$7.4M
- First Trust Advisors LP+145K sh$3.5M
- Portolan Capital Management, LLC−1M sh−$24.4M
- Eventide Asset Management, LLC−386K sh−$9.5M
- Palisade Capital Management, LP−304K sh−$7.2M
- Schroder Investment Management Group−299K sh−$7.0M
- Nuveen, LLC−290K sh−$6.9M
- Dimensional Fund Advisors LP−249K sh−$5.9M
- AIGH Capital Management LLCSold out−545K shNov 2
- Principal Financial Group IncTrimmed−226K shNov 2
- Mackenzie Financial CorpTrimmed−225K shNov 2
- Perkins Capital Management IncAdded+33K shNov 2
- Y-Intercept (Hong Kong) LtdSold out−32K shOct 16
- Counterpoint Mutual Funds LLCSold out−17K shOct 16
- Inspire Investing, LLCTrimmed−11K shOct 22
- Wealth Enhancement Advisory Services, LLCNew+8,868 shOct 13
From SEC Form 13F filings by funds managing over $100 million, as of Jun 30, 2026. Changes compare each fund with its own Q1 2026 filing. "Held by funds" adds up the shares every 13F filer reported, over shares outstanding. Filings come up to 45 days after the quarter ends. Not investment advice.
AI Auto Pilots
Paper tradingStreetAlpha runs four autonomous AI traders powered by Anthropic's Claude. Each one reads options flow, dark pool prints, insider filings, sentiment, macro signals and technicals, then makes its own trading decisions in a paper portfolio. Every decision is logged and every trade is tracked, so you can see whether CSTL is in one of them and how their past CSTL trades turned out.
Macro & Market News
All StreetAlpha news →StreetAlpha hasn't covered CSTL in an article yet. Here's the latest on the wider market.
CSTL Congress Trades
All congress trades →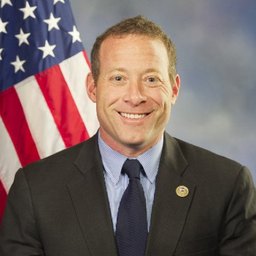
| Person | Type | Amount | Traded | Filed | Delay |
|---|---|---|---|---|---|
| Josh GottheimerD · NJ | Sell (partial) | $1K – $15K | Mar 15, 2022 | Apr 17, 2022 | 33 d |
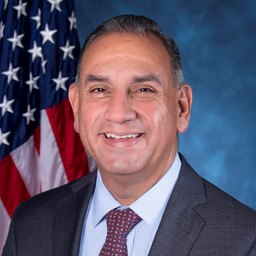
| Gilbert CisnerosD · CA | Buy | $1K – $15K | Dec 23, 2020 | Jan 11, 2021 | 19 d |
| Josh GottheimerD · NJ | Buy | $1K – $15K | Dec 21, 2020 | Jan 7, 2021 | 17 d |
Members of Congress and senior officials report trades up to 45 days later, as dollar ranges. Filings show a trade happened, not why. Not investment advice.
About Castle Biosciences
Castle Biosciences is a molecular diagnostics company based in Friendswood, Texas. It offers laboratory tests that help clinicians diagnose and manage treatment for skin cancers, Barrett's esophagus, uveal melanoma and atopic dermatitis. Its tests analyze patient samples to help estimate risk, guide treatment decisions and support diagnosis, and they are used by clinicians caring for these patients.
- Headquarters
- Friendswood, TX