
FirstService Corp (FSV)
FirstService Corp (FSV) is a Real Estate stock tracked by StreetAlpha. In the past 30 days there were 1 dark pool print totaling $3.1M, the largest $3.1M.
Key Stats
Fiscal 2025Not reported for this period.
From FSV's SEC filings, latest 40-F for the period ending Dec 31, 2025 (filed Feb 20). Per share figures are left out because the US listing can represent a different number of shares.
Analyst Ratings & Price Targets
Analyst Ratings →Based on 1 analyst who set a price target on FSV in the past 90 days. The average target is $178.00, with a high of $178.00 and a low of $178.00.
| Date | Firm | Action | Rating | Price target |
|---|---|---|---|---|
| Oct 23 | CIBC | Maintained | Buy | $178 |
| Jul 24 | BMO Capital | Maintained | Buy | $192 |
| Jun 30 | Scotiabank | Maintained | Buy | $175 |
| Jun 3 | TD Cowen | Reiterated | Buy | $204 |
Whale Options Flow
90DNo whale options trades in FSV in the last 90 days.
Dark Pool
30DFSV Institutional Ownership
Hedge fund holdings →- 1832 Asset Management L.P.+1.3M sh$180.0M
- Norges Bank+550K sh$78.1M
- Morgan Stanley+261K sh$37.2M
- Manufacturers Life Insurance Company, the+149K sh$21.1M
- CIBC Asset Management Inc+140K sh$19.8M
- Goldman Sachs Group Inc+114K sh$16.2M
- Mackenzie Financial Corp−715K sh−$144.2M
- Wellington Management Group LLP−286K sh−$40.7M
- William Blair Investment Management, LLC−282K sh−$40.1M
- Voya Investment Management LLC−241K sh−$33.5M
- Conestoga Capital Advisors, LLC−189K sh−$26.8M
- Fred Alger Management, LLC−178K sh−$25.3M
- Conestoga Capital Advisors, LLCTrimmed−463K shNov 2
- Montrusco Bolton Investments Inc.Trimmed−59K shOct 13
- Mackenzie Financial CorpTrimmed−51K shNov 2
- Zwj Investment Counsel IncAdded+42K shOct 15
- Copeland Capital Management, LLCAdded+41K shOct 13
- JCIC Asset Management Inc.Sold out−18K shOct 30
- Creative PlanningTrimmed−12K shNov 2
- Pembroke Management, LTDAdded+12K shOct 21
From SEC Form 13F filings by funds managing over $100 million, as of Jun 30, 2026. Changes compare each fund with its own Q1 2026 filing. Filings come up to 45 days after the quarter ends. Put/call compares the value of puts and calls funds reported ($0 in puts, $7.1M in calls), leaving out market makers and bank trading desks. Not investment advice.
AI Auto Pilots
Paper tradingStreetAlpha runs four autonomous AI traders powered by Anthropic's Claude. Each one reads options flow, dark pool prints, insider filings, sentiment, macro signals and technicals, then makes its own trading decisions in a paper portfolio. Every decision is logged and every trade is tracked, so you can see whether FSV is in one of them and how their past FSV trades turned out.
Macro & Market News
All StreetAlpha news →StreetAlpha hasn't covered FSV in an article yet. Here's the latest on the wider market.
FSV Congress Trades
All congress trades →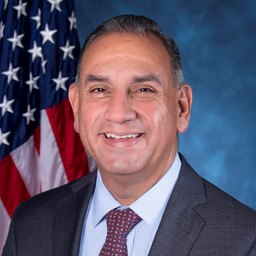
| Person | Type | Amount | Traded | Filed | Delay |
|---|---|---|---|---|---|
| Gilbert CisnerosD · CA | Buy | $1K – $15K | Aug 19, 2026 | Sep 11, 2026 | 23 d |
| Gilbert CisnerosD · CA | Buy | $1K – $15K | Jun 11, 2026 | Jul 2, 2026 | 21 d |
| Gilbert CisnerosD · CA | Buy | $1K – $15K | May 11, 2026 | Jun 8, 2026 | 28 d |
| Gilbert CisnerosD · CA | Buy | $1K – $15K | May 7, 2026 | Jun 8, 2026 | 32 d |
| Gilbert CisnerosD · CA | Buy | $1K – $15K | May 1, 2026 | May 8, 2026 | 7 d |
Members of Congress and senior officials report trades up to 45 days later, as dollar ranges. Filings show a trade happened, not why. Not investment advice.