Bitcoin's Diminishing Cycles: A Data-Driven Warning for What Comes Next
Three complete cycles tell a consistent story. The next peak may not exceed today's price.

Photo by Kanchanara on Unsplash
A decade of Bitcoin price data reveals shrinking cycles, a projected October 2026 bottom near $30–34k, and a C5 top that may never reclaim the current ATH.
The Four-Year Cycle Is Real — and It's Compressing
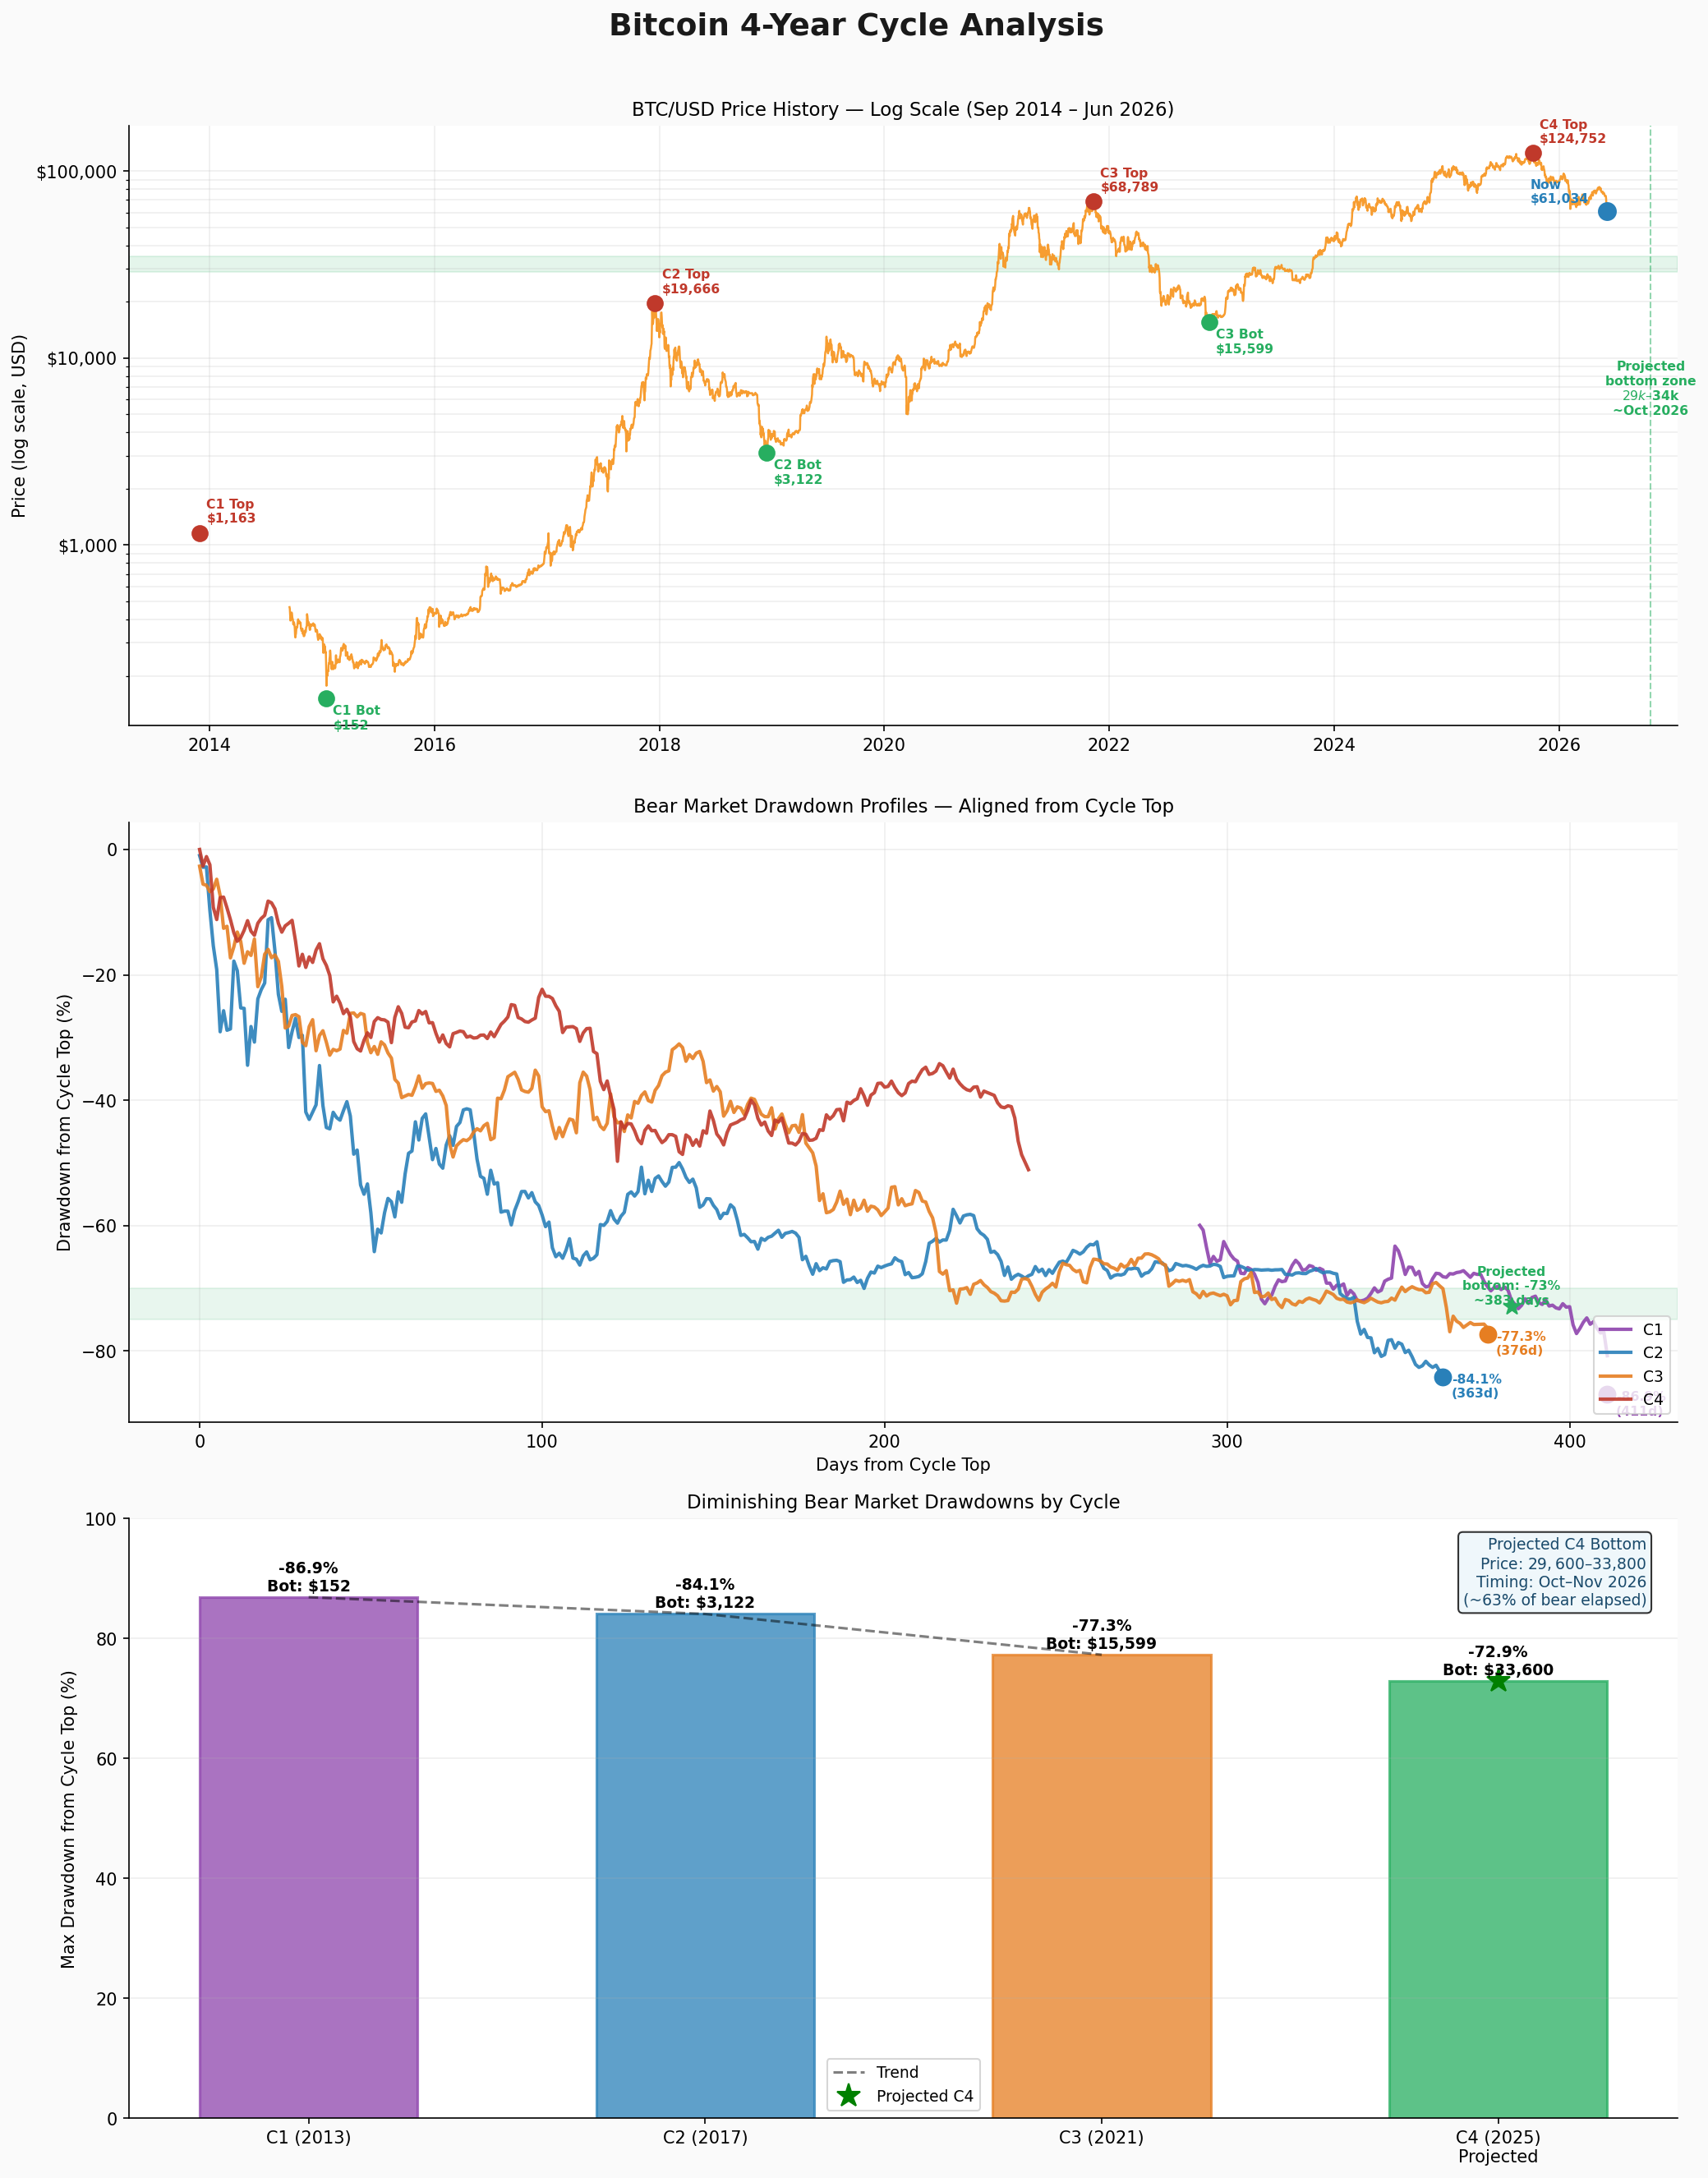
Bitcoin runs on an approximate four-year rhythm tied loosely to its halving schedule. Each cycle follows the same arc: a parabolic run to a new all-time high, a brutal bear market, then a slow recovery that sets the stage for the next run. Three complete cycles are now in the books, and the pattern is intact. But something important is changing at each iteration.
The confirmed C4 cycle top was October 7, 2025 at $124,752. Bitcoin is currently in its bear market phase, sitting near $61,000, down roughly 51% from that high. Based on historical patterns, significantly more downside is ahead before the floor is found.
| Cycle | Top | Bottom | Drawdown |
|---|---|---|---|
| C1 — 2013 | $1,163 | $152 | -86.9% |
| C2 — 2017 | $19,666 | $3,122 | -84.1% |
| C3 — 2021 | $68,789 | $15,599 | -77.3% |
| C4 — 2025 | $124,752 | Ongoing | Projected -73% |
How Bad Does This Bear Market Get?
The drawdown trend is consistent enough to be meaningful. Three independent methodologies — a linear trend fit, a geometric ratio, and a rising floor percentage model — all converge on the same answer: a projected bottom between $29,600 and $33,800, representing a roughly 73% decline from the October 2025 high.
From current levels near $61,000, that implies another 43 to 52% of downside before the floor is found. That is not a comfortable number. But it is what the data says.
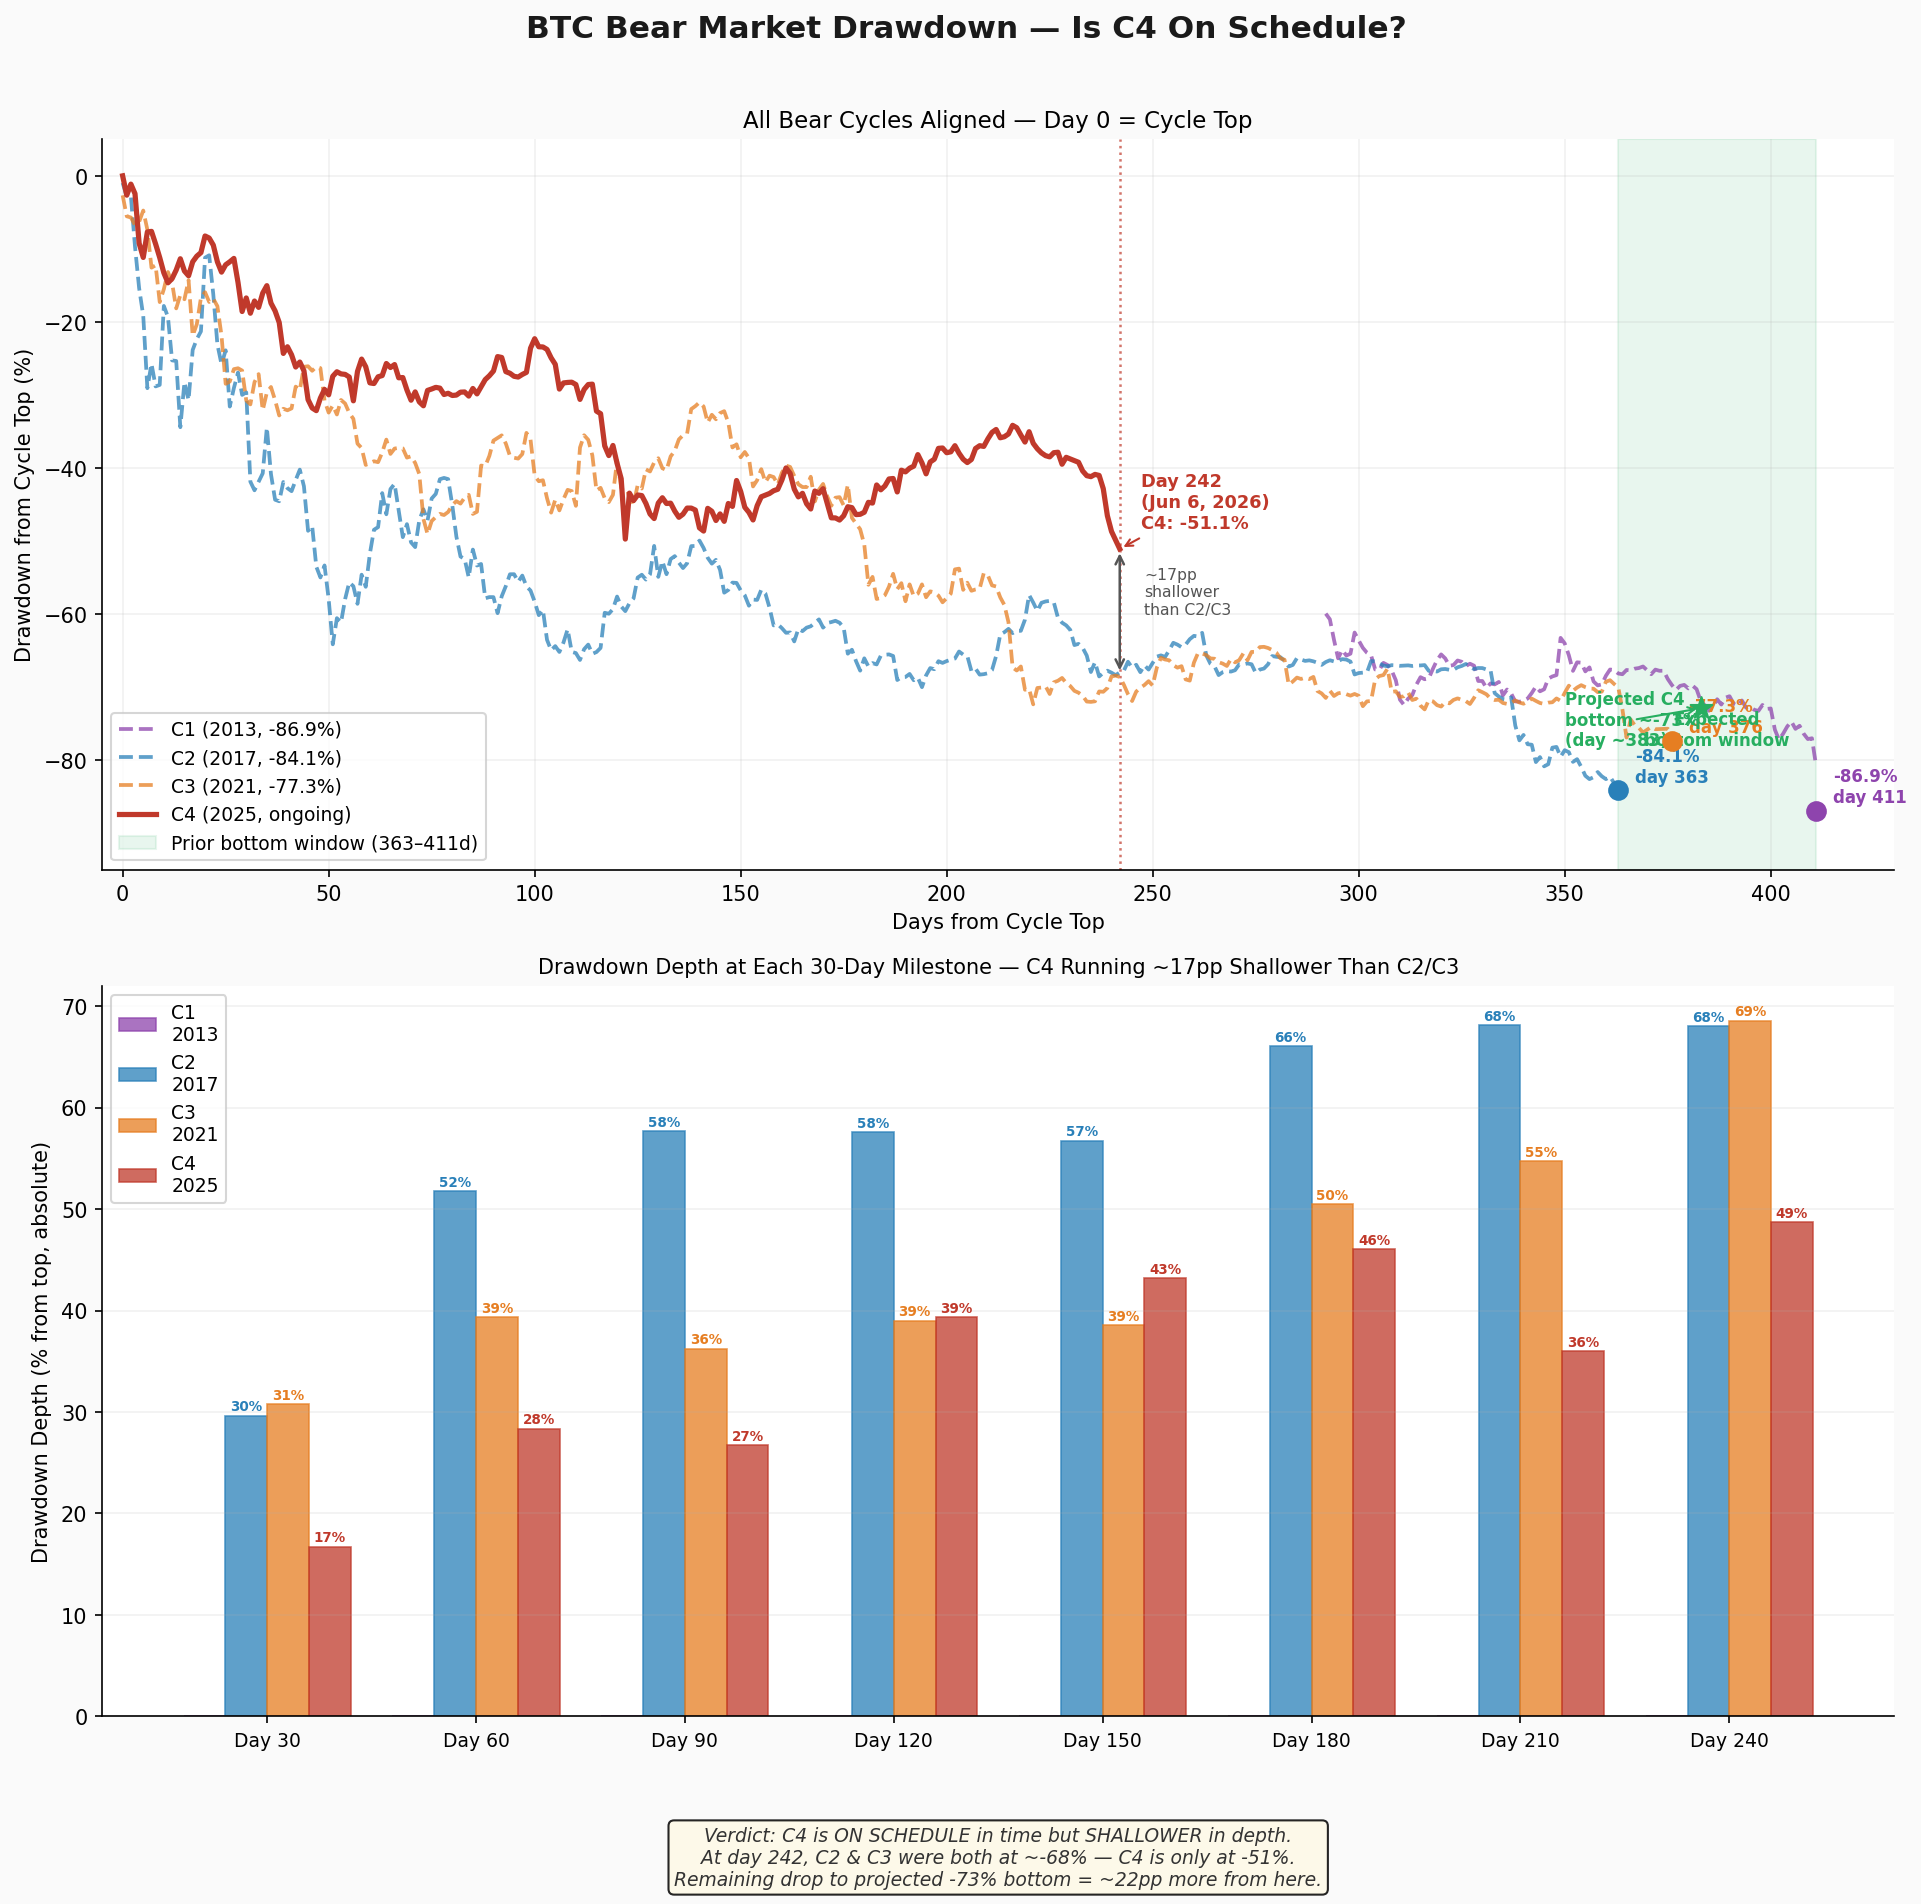
Today is day 241 from the October 7 cycle top. At this same point in prior cycles, C2 and C3 were both sitting at roughly 68% drawdowns. C4 is only at 51%. That 17-point gap is consistent with the diminishment trend. The timing of prior cycle bottoms is also remarkably tight: C1 bottomed at day 411, C2 at day 363, C3 at day 376. The average of 383 days maps onto October 18 to 25, 2026 as the projected C4 bottom window.
The Path Between Now and the Bottom
The path to the bottom is not a straight line down. Historical bear markets grind sideways for extended stretches before the final capitulation leg. C4 is unlikely to be different.
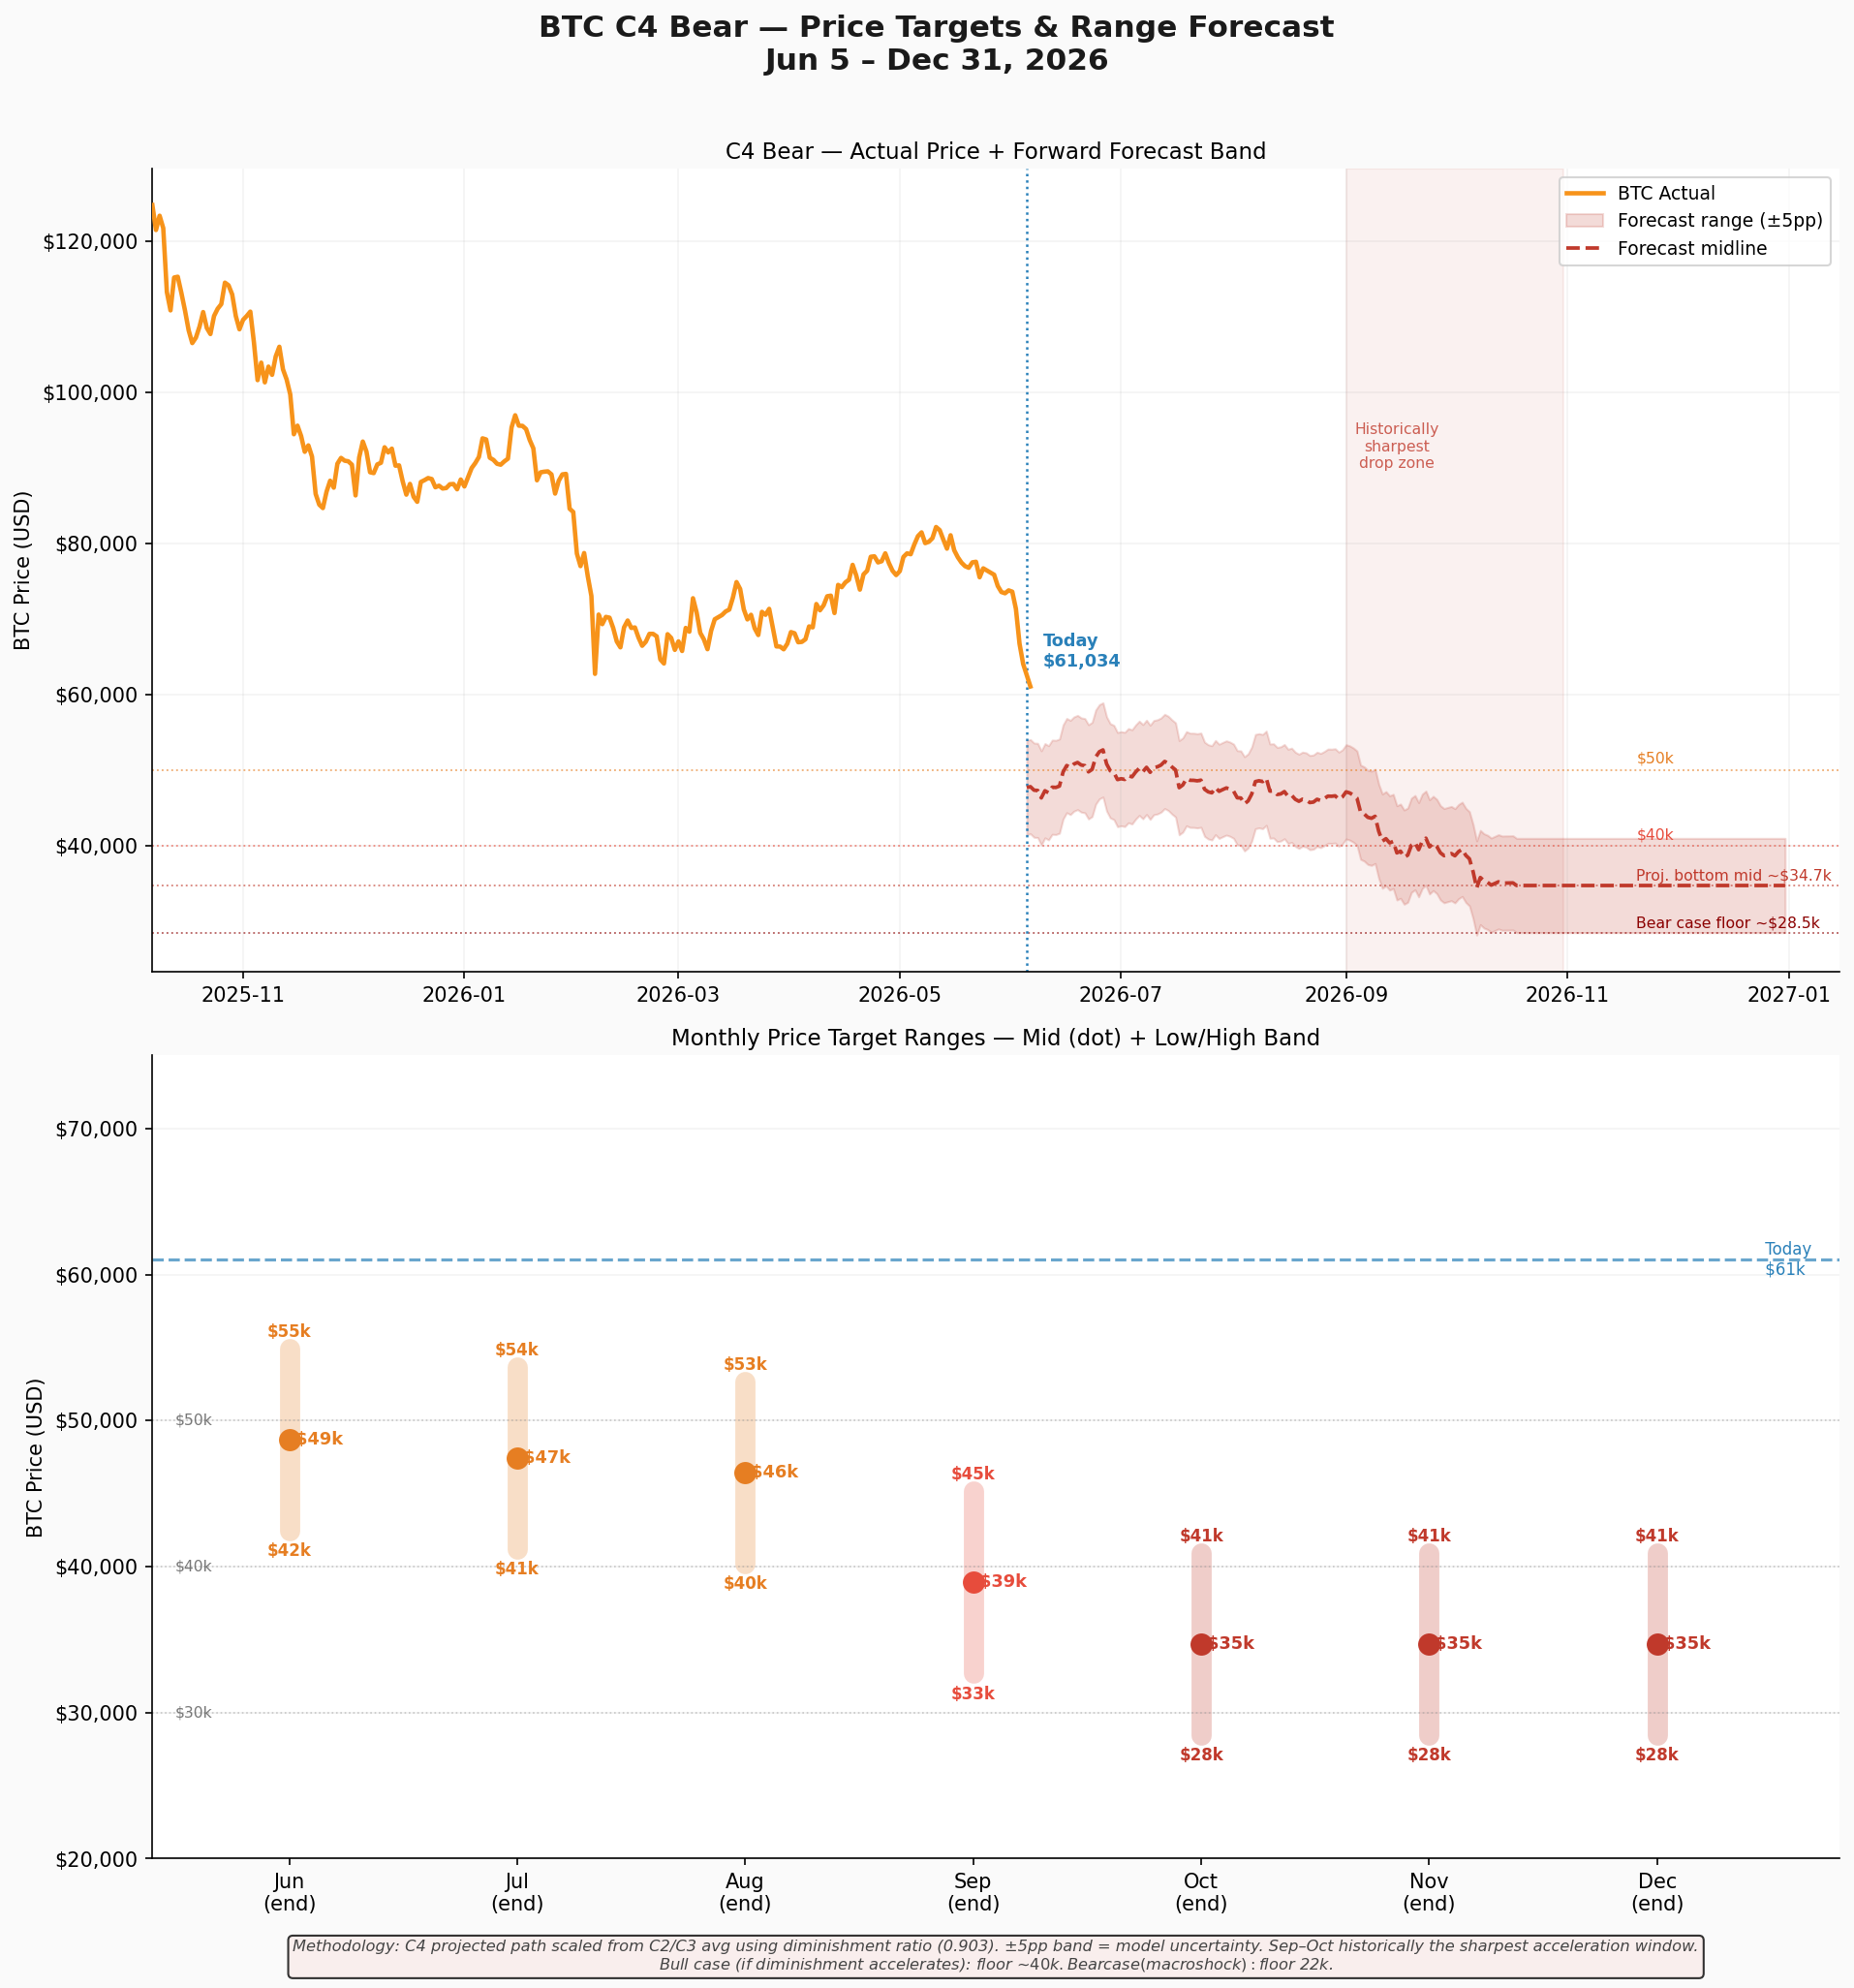
| Period | Price Range | Midline |
|---|---|---|
| June 2026 | $42k – $55k | ~$49k |
| July 2026 | $41k – $54k | ~$47k |
| August 2026 | $40k – $53k | ~$46k |
| September 2026 | $33k – $45k | ~$39k |
| October 2026 | $28k – $41k | ~$35k |
The September step-down is the critical moment. The model projects the midline dropping roughly $7,000 in a single month as the final leg begins. This is consistent with how C2 behaved — sideways for weeks in the $3,400 to $3,900 range, then a sharp final flush in the last six weeks before the December 15, 2018 bottom. C3 had an external trigger in the FTX collapse on November 9, 2022. Whether C4 has a similar catalyst or simply exhausts itself on schedule is unknown, but the destination looks similar regardless.
The S&P 500 Is Not Worried — and That Matters
One of the most telling data points in this entire analysis is how the equity market has responded to Bitcoin's bear market. The short answer: it has not.
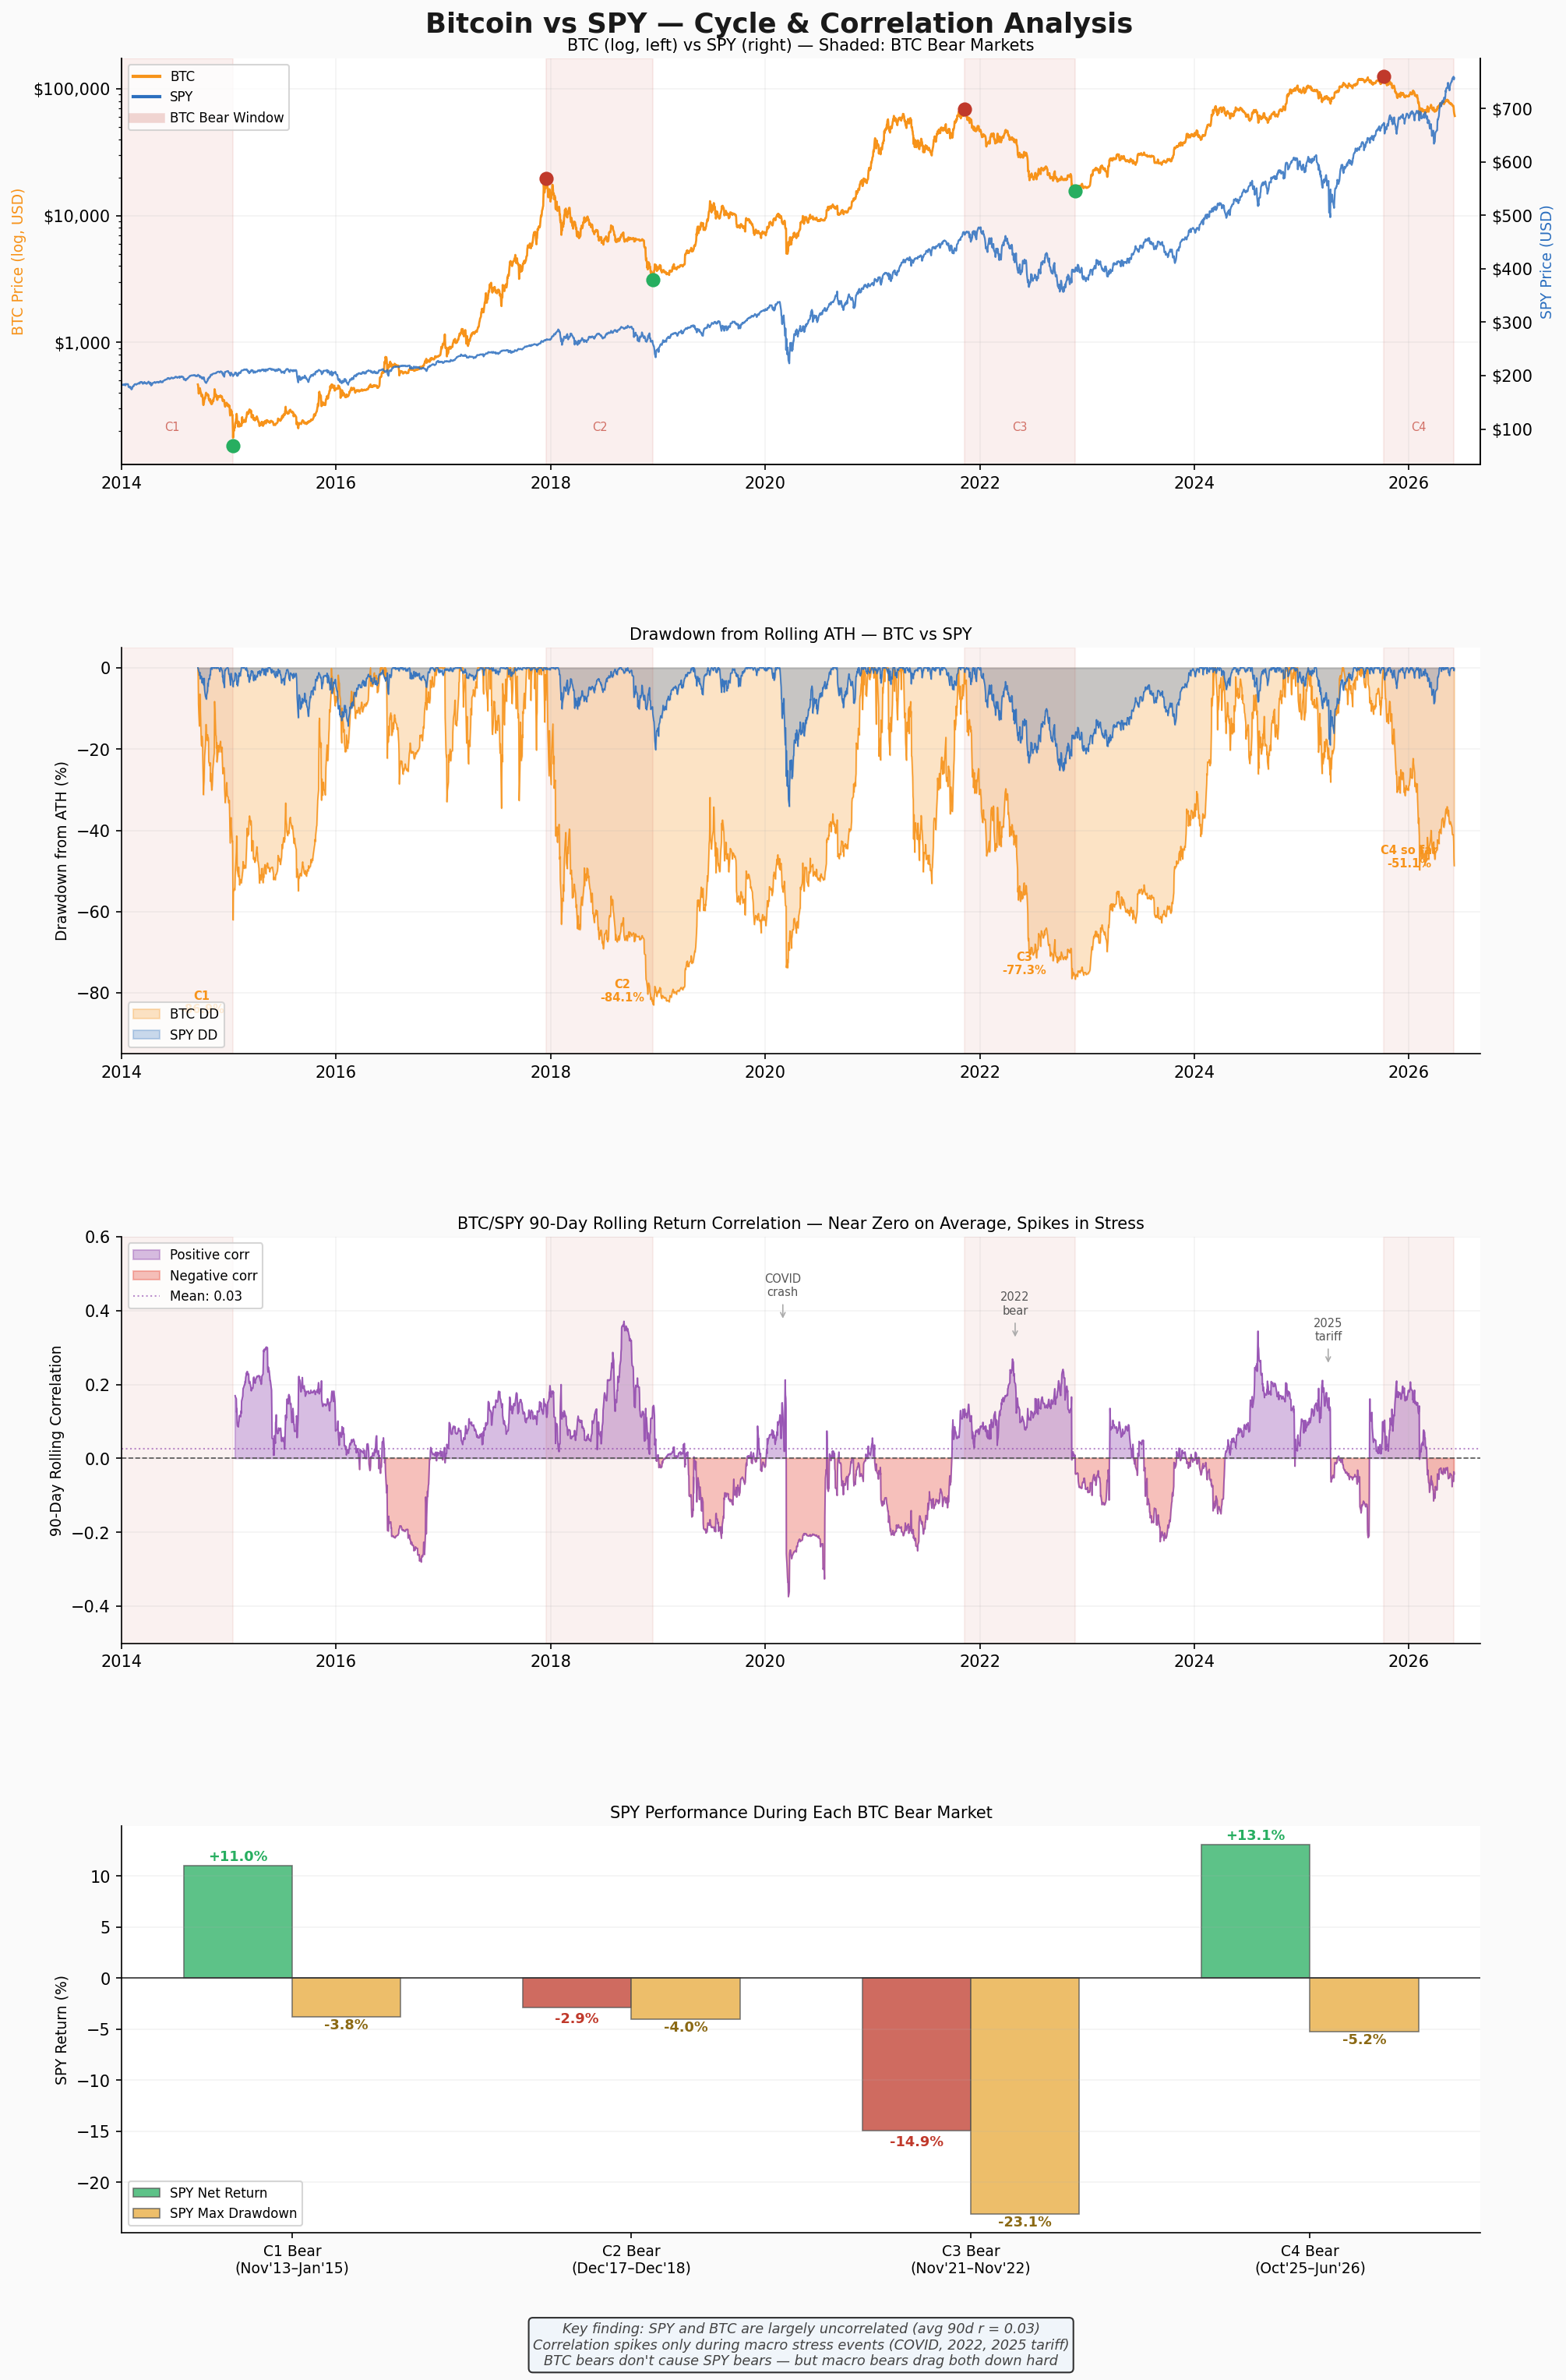
The 90-day rolling correlation between Bitcoin daily returns and SPY daily returns averages just 0.03 over the entire period since 2014. Essentially zero. SPY was up 11% during the C1 Bitcoin bear, roughly flat during C2, and is up approximately 13% so far in C4 while Bitcoin has shed half its value.
Correlation spikes sharply — and only — during genuine macro stress events. The COVID crash saw SPY fall 34% while Bitcoin fell 51%. The 2022 rate hike bear drove SPY down 25% and Bitcoin down 61%. The 2025 tariff selloff pulled both down roughly 18 to 19%. Outside of those episodes, Bitcoin's bear markets are invisible to the equity market. The causality runs one direction: macro crises drag Bitcoin down harder than equities, not the other way around.
The Recovery: Slow, Modest, and Potentially Underwhelming
The duration of bull markets is not the problem. All three prior bull runs lasted almost exactly the same length — 1,051 to 1,068 days from bottom to top. The C4 bull is projected to run approximately 1,043 days, putting the C5 top in August to September 2029.

The multiplier is the problem. C1 to C2 produced a 129x gain. C2 to C3 delivered 22x. C3 to C4 came in at 8x. The projected C4 to C5 gain is approximately 2.1x. From a $33,600 bottom, that produces a C5 top near $71,700 — below Bitcoin's current all-time high of $124,752.
| Date | Mid Target | Range |
|---|---|---|
| Jan 2027 — 3 months | ~$36k | $29k – $43k |
| Apr 2027 — 6 months | ~$39k | $31k – $47k |
| Oct 2027 — 1 year | ~$40k | $32k – $48k |
| Oct 2028 — 2 years | ~$58k | $46k – $69k |
| Aug 2029 — C5 top | ~$72k | $57k – $86k |
Is Bitcoin Becoming a Novelty?
The diminishing cycle data tells a coherent story. Bitcoin's explosive growth phase appears to be behind it. Each cycle, the gains compress, the crashes get shallower, and the asset increasingly behaves like something that has found its rough equilibrium rather than something still in price discovery.
The original thesis — Bitcoin as digital cash — did not materialize in any meaningful transactional sense. The store of value narrative took hold, but it competes with gold, T-bills, and a dozen other assets. Eight times from the C3 bottom is strong in isolation. In context, it is one-third of what the prior cycle delivered.
Three scenarios present themselves. In the range asset scenario, Bitcoin finds a $30,000 to $100,000 band and oscillates within it on its four-year cycle indefinitely — tradeable and predictable, but not a wealth-creation machine. In the acceleration break scenario, a genuine new use case disrupts the diminishment trend and the C5 top significantly exceeds the model. In the secular decline scenario, cycle tops eventually stop exceeding prior highs entirely.
The data, as of today, is most consistent with the range asset scenario. The trend has been stable across three full cycles. What the data does not support is the assumption that the next cycle will look like 2020 to 2021. That era, by the numbers, appears to be over. Watch whether Bitcoin holds support in the $40,000 to $45,000 range in late summer — that is the next meaningful read on this thesis.
For informational purposes only. Not investment advice. Published Saturday, June 6, 2026.